目次
概要
背景
どうしてこうなった…
K8 vs Pen4 の頃は輝いていたのに…
何故K10(Phenom世代)は、Core2以降負け続けなのか?
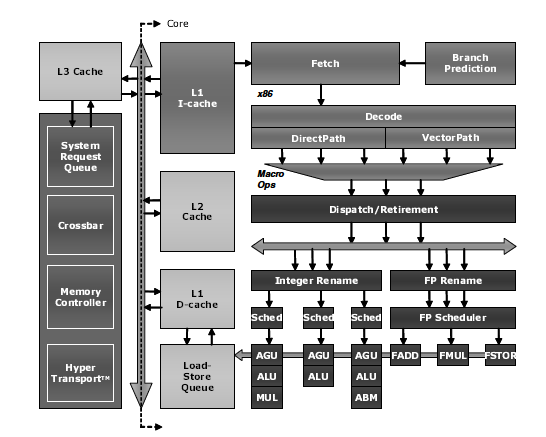
K10パイプライン(Software Optimization Guide for AMD Family 10h Processorsより)
整数3つ、浮動小数乗算、浮動小数加算、浮動小数その他のうちから3つを実行可能。
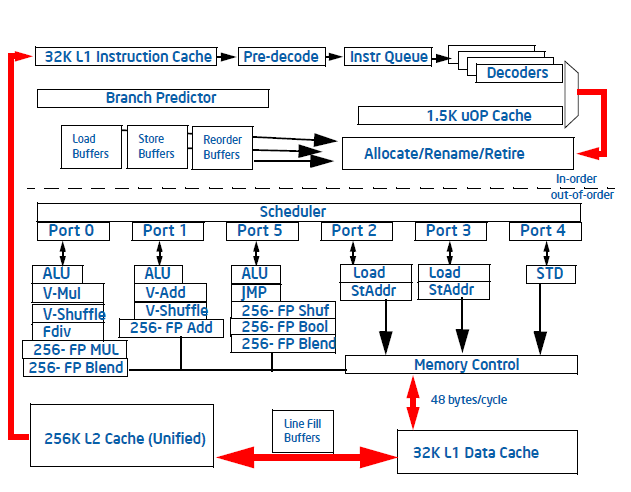
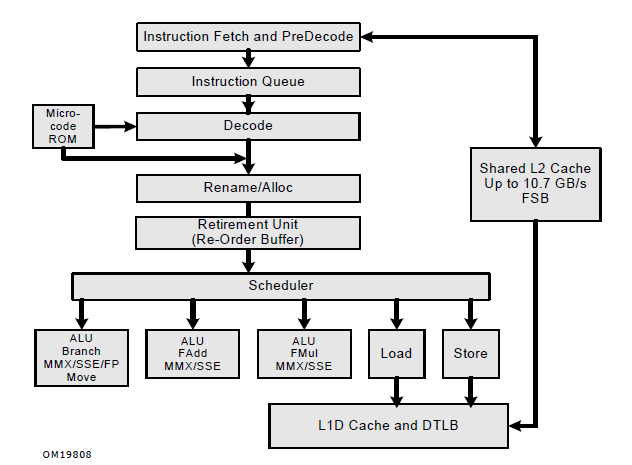
Sandyちゃんパイプライン (Intel(R) 64 and IA-32 Architectures Optimization Reference Manualより)
整数3つ、浮動小数乗算、浮動小数加算、ロードx2、ストアのうちから4つを実行可能。
Core2パイプライン(Intel(R) 64 and IA-32 Architectures Optimization Reference Manualより)
整数3つ、浮動小数乗算、浮動小数加算、ロード、ストアのうちから4つを実行可能。
整数3つ、浮動小数乗算x1、浮動小数加算x1という構成はどれも一緒。なので、理論性能はそれほど変わらんはず。
Agnerさんの資料のmicroarchitecture.pdfには、まとめのところで、それぞれのアーキテクチャについて、 ボトルネックになりそうなところが書いてあって、(Comparison of microarchitecture) AMDは、
- 同じ機能を持った整数ユニットが3つあるのはシンプルだけどコスト大きいよね
- 3つのFPユニット間のやりとりがちょっとアレじゃね?
- (あとは基本的にいい感じ的なコメントが)
で、CoreMAが、
- 命令フェッチ16byteがよくない(Sandyでは改善)
- read port stall やめてくれ(Sandyでは改善)
- branch history pattern table小さい (Sandyでは…どうだっけ)
- memory read が 1/cycle しかない(Sandyでは改善)
- (あとは前の世代よりは改善されてますね的なコメントが)
とかみたいなコメントが書いてある。 それを踏まえると、「Core2ではK10に勝てなかったが、Sandyでようやく追い付いた」的な印象を持ちそうなのだが、 でも実際は、「Core2で一歩抜き出て、Sandyで引き離した」という状態。
なんでそうなるの、というのが長年の疑問だったが、いい機会なので調べておくか、という内容
調査方法
parsecを動かして、perfで色々データ集めて、Core i5 2400S vs A8-3650 、Core i3 530 vs A8-3650 で、ボトルネックどこなのかとマニュアルを見比べたりしながら色々考察する。
parsec
並列アーキテクチャをベンチマークするプログラム群で、色んな分野をカバーしていて、メモリアクセスパターンが色々あるのが特徴。
本来はマルチスレッド用というか、並列プロセッサシミュレーション用ベンチなのだが、 今回はマルチスレッドについては特に考えない。マルチスレッド編はまたの機会に。
phoronix-test-suiteとどっち使うか迷ったが、parsecのほうが使いやすかったのと、21世紀感溢れるアプリが多いので、今回はparsecを選択。
環境
| 名前 | CPU | メモリ | カーネル |
| Sandy代表 | i5-2400S (2.5GHz) | 忘れた(多分DDR3-1333 x2ch) | 3.0 |
| Nehalem代表 | i3-530 (2.93GHz) | 忘れた(多分DDR3-1333 x2ch) | 3.0 |
| k10代表 | A8-3650 (2.6GHz) | 忘れた(多分DDR3-1600 x2ch) | 3.0 |
クロックはBIOSの設定で変わらないようにしてる。
GCCは4.6.0。
/usr/bin/gcc -O3 -funroll-loops -fprefetch-loop-arrays -g # parsecのデフォルト
で、A8-3650上でビルドした同じバイナリを使う。-mtune=nativeは効果が見えなかったので付けない。
IPC
nativeでひととおり動かした。facesimはビルドエラーでよくわからんかったのと、freqmineは時間かかりすぎだったので動かしてない。
| テスト名 | i3-530-thread2 | a8-3650-mtune-thread4 | 2400S-thread4 | a8-3650-thread4 | Nehalem:k10 | Sandy:k10 | Sandy:Nehalem | k10-mtune:k10 |
| canneal | 0.150 | 0.150 | 0.230 | 0.137 | 1.09 | 1.68 | 1.53 | 1.09 |
| raytrace | 1.470 | 0.950 | 1.600 | 0.990 | 1.48 | 1.62 | 1.09 | 0.96 |
| x264 | 1.160 | 1.250 | 1.370 | 1.264 | 0.92 | 1.08 | 1.18 | 0.99 |
| swaptions | 1.610 | 1.410 | 1.830 | 1.433 | 1.12 | 1.28 | 1.14 | 0.98 |
| ferret | 1.200 | 1.140 | 1.350 | 1.082 | 1.11 | 1.25 | 1.13 | 1.05 |
| dedup | 0.890 | 0.940 | 1.180 | 0.954 | 0.93 | 1.24 | 1.33 | 0.99 |
| fluidanimate | 1.560 | 1.170 | 2.020 | 1.110 | 1.41 | 1.82 | 1.29 | 1.05 |
| streamcluster | 0.550 | 0.570 | 0.830 | 0.564 | 0.98 | 1.47 | 1.51 | 1.01 |
| vips | 1.970 | 1.660 | 2.220 | 1.698 | 1.16 | 1.31 | 1.13 | 0.98 |
| bodytrack | 1.590 | 1.190 | 1.750 | 1.130 | 1.41 | 1.55 | 1.10 | 1.05 |
| blackscholes | 1.260 | 1.150 | 1.450 | 1.151 | 1.09 | 1.26 | 1.15 | 1.00 |
という感じで、「k10 < Nehalem << Sandy」ぽい雰囲気を感じられるかと。(あと-mtune=nativeはあまり変わらんというか、若干悪くなってるというのも)
メモリの影響少なそうなblackshcoles、raytraceでもSandy、NehalemのほうがIPCよい。 なので、たまに見かける「コアは互角だが、キャッシュ良いからIntel勝ってる説」は、あまり信憑性無いのではないかと思う。
fluidanimate
一番差の大きいfluidanimateから見ていく。粒子法の流体シミュレーション。
perf annotate -l した結果が、
=== a8 ===
Sorted summary for file /home/w0/src/parsec-2.1/pkgs/apps/fluidanimate/inst/amd64-linux.gcc/bin/fluid
----------------------------------------------

   14.65 /home/w0/src/parsec-2.1/pkgs/apps/fluidanimate/obj/amd64-linux.gcc/pthreads.cpp:671
   10.16 /home/w0/src/parsec-2.1/pkgs/apps/fluidanimate/obj/amd64-linux.gcc/pthreads.cpp:67
    7.83 /home/w0/src/parsec-2.1/pkgs/apps/fluidanimate/obj/amd64-linux.gcc/pthreads.cpp:677
    7.24 /home/w0/src/parsec-2.1/pkgs/apps/fluidanimate/obj/amd64-linux.gcc/pthreads.cpp:73
    6.95 /usr/lib/gcc/x86_64-unknown-linux-gnu/4.6.0/../../../../include/c++/4.6.0/bits/stl_algobase.h:216
    4.90 /home/w0/src/parsec-2.1/pkgs/apps/fluidanimate/obj/amd64-linux.gcc/pthreads.cpp:67
    4.57 /home/w0/src/parsec-2.1/pkgs/apps/fluidanimate/obj/amd64-linux.gcc/pthreads.cpp:67
    3.57 /home/w0/src/parsec-2.1/pkgs/apps/fluidanimate/obj/amd64-linux.gcc/pthreads.cpp:676
    2.26 /home/w0/src/parsec-2.1/pkgs/apps/fluidanimate/obj/amd64-linux.gcc/pthreads.cpp:677
    1.92 /home/w0/src/parsec-2.1/pkgs/apps/fluidanimate/obj/amd64-linux.gcc/pthreads.cpp:677
    1.77 /home/w0/src/parsec-2.1/pkgs/apps/fluidanimate/obj/amd64-linux.gcc/pthreads.cpp:73
    1.66 /home/w0/src/parsec-2.1/pkgs/apps/fluidanimate/obj/amd64-linux.gcc/pthreads.cpp:686
    1.42 /home/w0/src/parsec-2.1/pkgs/apps/fluidanimate/obj/amd64-linux.gcc/pthreads.cpp:676
    (..snip..)

=== Sandy ===
Sorted summary for file /home/w0/src/parsec-2.1/pkgs/apps/fluidanimate/inst/amd64-linux.gcc/bin/fluid
----------------------------------------------

    9.83 /home/w0/src/parsec-2.1/pkgs/apps/fluidanimate/obj/amd64-linux.gcc/pthreads.cpp:69
    6.48 /home/w0/src/parsec-2.1/pkgs/apps/fluidanimate/obj/amd64-linux.gcc/pthreads.cpp:681
    5.56 /home/w0/src/parsec-2.1/pkgs/apps/fluidanimate/obj/amd64-linux.gcc/pthreads.cpp:69
    5.50 /home/w0/src/parsec-2.1/pkgs/apps/fluidanimate/obj/amd64-linux.gcc/pthreads.cpp:690
    3.74 /home/w0/src/parsec-2.1/pkgs/apps/fluidanimate/obj/amd64-linux.gcc/pthreads.cpp:687
    3.47 /home/w0/src/parsec-2.1/pkgs/apps/fluidanimate/obj/amd64-linux.gcc/pthreads.cpp:681
    2.74 /home/w0/src/parsec-2.1/pkgs/apps/fluidanimate/obj/amd64-linux.gcc/pthreads.cpp:67
    2.67 /home/w0/src/parsec-2.1/pkgs/apps/fluidanimate/obj/amd64-linux.gcc/pthreads.cpp:73
    2.39 /home/w0/src/parsec-2.1/pkgs/apps/fluidanimate/obj/amd64-linux.gcc/pthreads.cpp:677
    2.38 /home/w0/src/parsec-2.1/pkgs/apps/fluidanimate/obj/amd64-linux.gcc/pthreads.cpp:62
    (..snip..)
どういうコードなのかというと、
void ComputeForcesMT(int i)
{
    int neighCells[27];

    for(int iz = grids[i].sz; iz < grids[i].ez; ++iz)
        for(int iy = grids[i].sy; iy < grids[i].ey; ++iy)
            for(int ix = grids[i].sx; ix < grids[i].ex; ++ix)
            {
                int index = (iz*ny + iy)*nx + ix;
                int np = cnumPars[index];
                if(np == 0)
                    continue;

                int numNeighCells = InitNeighCellList(ix, iy, iz, neighCells);

                Cell &cell = cells[index];

                for(int j = 0; j < np; ++j) // pthread.cpp:671 ここ
                    for(int inc = 0; inc < numNeighCells; ++inc)
                    {
                        int indexNeigh = neighCells[inc];
                        Cell &neigh = cells[indexNeigh];
                        int numNeighPars = cnumPars[indexNeigh];
                        for(int iparNeigh = 0; iparNeigh < numNeighPars; ++iparNeigh)
                            if(&neigh.p[iparNeigh] < &cell.p[j])
                            {
                                Vec3 disp = cell.p[j] - neigh.p[iparNeigh];
                                float distSq = disp.GetLengthSq();
                                if(distSq < hSq)
                                {
                                    float dist = sqrtf(std::max(distSq, 1e-12f));
                                    float hmr = h - dist;

                                    Vec3 acc = disp * pressureCoeff * (hmr*hmr/dist) * (cell.density[j]+neigh.density[iparNeigh] - doubleRestDensity);
                                    acc += (neigh.v[iparNeigh] - cell.v[j]) * viscosityCoeff * hmr;
                                    acc /= cell.density[j] * neigh.density[iparNeigh];

                                    if(border[index])
                                    {
                                        pthread_mutex_lock(&mutex[index][j]);
                                        cell.a[j] += acc;
                                        pthread_mutex_unlock(&mutex[index][j]);
                                    }
                                    else
                                        cell.a[j] += acc;

                                    if(border[indexNeigh])
                                    {
                                        pthread_mutex_lock(&mutex[indexNeigh][iparNeigh]);
                                        neigh.a[iparNeigh] -= acc;
                                        pthread_mutex_unlock(&mutex[indexNeigh][iparNeigh]);
                                    }
                                    else
                                        neigh.a[iparNeigh] -= acc;
                                }
                            }
                    }
            }
}
で、np を出力してみると、1-30ぐらいの範囲で、ランダムになっている。と、いうことから、分岐予測ミスではないか、というのが予想される。 perf statの結果を見ると、
==== A8-3650 ====
     634648.594428 task-clock                #    3.802 CPUs utilized
             27711 context-switches          #    0.000 M/sec
               711 CPU-migrations            #    0.000 M/sec
             48866 page-faults               #    0.000 M/sec
     1646070415854 cycles                    #    2.594 GHz                     [66.66%]
      181009624010 stalled-cycles-frontend   #   11.00% frontend cycles idle    [66.65%]
      616491983666 stalled-cycles-backend    #   37.45% backend  cycles idle    [66.67%]
     1829342086971 instructions              #    1.11  insns per cycle
                                             #    0.34  stalled cycles per insn [66.70%]
      252422929439 branches                  #  397.737 M/sec                   [66.68%]
       19216984246 branch-misses             #    7.61% of all branches         [66.66%]

     166.920539003 seconds time elapsed

==== i3-530 ====
     396489.171596 task-clock                #    1.987 CPUs utilized
             48029 context-switches          #    0.000 M/sec
                39 CPU-migrations            #    0.000 M/sec
             47692 page-faults               #    0.000 M/sec
     1162495432622 cycles                    #    2.932 GHz
      473381019373 stalled-cycles-frontend   #   40.72% frontend cycles idle
      215023210017 stalled-cycles-backend    #   18.50% backend  cycles idle
     1807703455511 instructions              #    1.56  insns per cycle
                                             #    0.26  stalled cycles per insn
      247219462439 branches                  #  623.521 M/sec
       10516043750 branch-misses             #    4.25% of all branches

     199.534946072 seconds time elapsed

==== i5-2400S ====
     349448.211947 task-clock                #    3.940 CPUs utilized
             43899 context-switches          #    0.000 M/sec
               122 CPU-migrations            #    0.000 M/sec
             48821 page-faults               #    0.000 M/sec
      907812451206 cycles                    #    2.598 GHz
      392296875513 stalled-cycles-frontend   #   43.21% frontend cycles idle
      170485441720 stalled-cycles-backend    #   18.78% backend  cycles idle
     1829316525780 instructions              #    2.02  insns per cycle
                                             #    0.21  stalled cycles per insn
      252318006844 branches                  #  722.047 M/sec
        2117310428 branch-misses             #    0.84% of all branches

      88.687247635 seconds time elapsed
とか、なっていて、A8-3650では、分岐ミス増えているのが確認できる。 つか、Sandyは当たりすぎでなんかの間違いじゃないか?という値が出てるよな…
#include <stdlib.h>
__attribute__((noinline))
int test(int n)
{
    int i;
    for (i=0; i<n; i++) {
        asm volatile ("#":"+r"(n)::"memory");
    }
}

int main(int argc, char **argv)
{
    int nloop = 100000;
    int i,ni;

    int val = atoi(argv[1]);

    int *table = malloc(val * sizeof(int));

    for (i=0; i<val; i++) {
        table[i] = (rand()>>8)%32;
    }

    for (ni=0; ni<nloop; ni++) {
        for (i=0; i<val; i++) {
            test(table[i]);
        }
    }
}
こういうプログラムを入れて、いくらかのカウントで回すと、
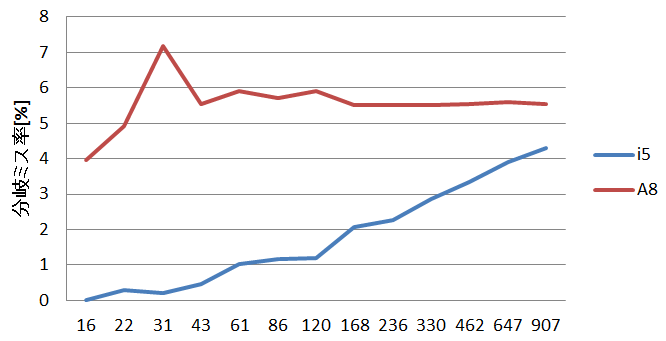
分岐ミス
で、Sandyのほうが、なんかもう一段階上位の分岐予測が入っているように見える。
というわけで、fluidanimateに関しては、Sandyのほうが分岐予測賢いので速いのではないかと思われる。 残念ながら、分岐予測の詳細は公開されていないので何が起こっているのかはよくわからない… 一応、公開情報としては、
- Core2でループ検出器が入った
- Nehalemはそれを踏襲した
- Sandy で uOPs cache が実装された時に、分岐予測回りはかなり修正された
らしい…
まとめ
fluidanimateが特に遅いのは、K10の分岐予測の弱点、というか、Sandyでは強化されてる点を突いてるから、のように見える
raytrace
Nehalem→Sandyでかなり速くなってるcannealとかも気になるが、テーマはK10なので忘れて、次に差の大きいraytrace。
perf stat の結果は以下のとおり
==== i5-2400S ====
     276476.335528 task-clock                #    2.346 CPUs utilized
              6489 context-switches          #    0.000 M/sec
               455 CPU-migrations            #    0.000 M/sec
            479154 page-faults               #    0.002 M/sec
      761636503934 cycles                    #    2.755 GHz
      372710273476 stalled-cycles-frontend   #   48.94% frontend cycles idle
      135790790034 stalled-cycles-backend    #   17.83% backend  cycles idle
     1223469302542 instructions              #    1.61  insns per cycle
                                             #    0.30  stalled cycles per insn
       66786675149 branches                  #  241.564 M/sec
        1539985410 branch-misses             #    2.31% of all branches

     117.869291995 seconds time elapsed


==== A8-3650 ====
     477366.555644 task-clock                #    2.299 CPUs utilized
              4628 context-switches          #    0.000 M/sec
               184 CPU-migrations            #    0.000 M/sec
            479096 page-faults               #    0.001 M/sec
     1238241854146 cycles                    #    2.594 GHz                     [66.67%]
       34655165282 stalled-cycles-frontend   #    2.80% frontend cycles idle    [66.67%]
      698615532522 stalled-cycles-backend    #   56.42% backend  cycles idle    [66.66%]
     1223721649556 instructions              #    0.99  insns per cycle
                                             #    0.57  stalled cycles per insn [66.67%]
       66903980096 branches                  #  140.152 M/sec                   [66.68%]
        1863772658 branch-misses             #    2.79% of all branches         [66.67%]

     207.633635798 seconds time elapsed
perf reportは以下
==== i5-2400 ====
    60.15%     177362   rtview  rtview               [.] void RTTL::TraverseBVH_with_StandardMesh<16, 6, 0, 0>(RTTL::RayPacket<16, 6, 0, 0>&, RTTL::AABB const*, int const*, RTTL::StandardTriangleMesh const&)
     8.42%      24783   rtview  rtview               [.] Context::task(int)
     5.95%      13851   rtview  rtview               [.] RTTL::BinnedAllDimsSaveSpace::recursiveBuildFast(RTTL::CentroidDiffAABB const*, int, int&, int, int, RTTL::AABB const&, RTTL::AABB const&, bool)
     4.42%      10280   rtview  rtview               [.] std::map<std::pair<int, std::pair<int, int> >, int, std::less<std::pair<int, std::pair<int, int> > >, std::allocator<std::pair<std::pair<int, std::pair<int, int> > const, int> > >::operator[](std::pair<int, std::pair<int, int> > const&)
     3.91%       9103   rtview  rtview               [.] std::map<std::pair<int, std::pair<int, int> >, int, std::less<std::pair<int, std::pair<int, int> > >, std::allocator<std::pair<std::pair<int, std::pair<int, int> > const, int> > >::find(std::pair<int, std::pair<int, int> > const&)
     3.56%      10482   rtview  rtview               [.] void Shade_EyeLight_With_StandardMesh<16, 6, 0, 0>(RTTL::RayPacket<16, 6, 0, 0>&, RTTL::StandardTriangleMesh const&, RTTL::RTMaterial const*, RTTL::RTTextureObject<4, unsigned char>**, sse_i*)
     3.45%       8020   rtview  libc-2.13.so         [.] _IO_vfscanf_internal
     1.26%       2928   rtview  libc-2.13.so         [.] __GI_____strtoll_l_internal


==== A8-3650 ====
    64.83%     309260   rtview  rtview               [.] void RTTL::TraverseBVH_with_StandardMesh<16, 6, 0, 0>(RTTL::RayPacket<16, 6, 0, 0>&, RTTL::AABB const*, int const*, RTTL::StandardTriangleMesh const&)
     9.44%      45159   rtview  rtview               [.] RTTL::BinnedAllDimsSaveSpace::recursiveBuildFast(RTTL::CentroidDiffAABB const*, int, int&, int, int, RTTL::AABB const&, RTTL::AABB const&, bool)
     8.02%      38248   rtview  rtview               [.] Context::task(int)
     4.13%      19697   rtview  rtview               [.] void Shade_EyeLight_With_StandardMesh<16, 6, 0, 0>(RTTL::RayPacket<16, 6, 0, 0>&, RTTL::StandardTriangleMesh const&, RTTL::RTMaterial const*, RTTL::RTTextureObject<4, unsigned char>**, sse_i*)
     2.48%      11880   rtview  libc-2.13.so         [.] _IO_vfscanf_internal
     1.81%       8673   rtview  rtview               [.] std::map<std::pair<int, std::pair<int, int> >, int, std::less<std::pair<int, std::pair<int, int> > >, std::allocator<std::pair<std::pair<int, std::pair<int, int> > const, int> > >::find(std::pair<int, std::pair<int, int> > const&)
     1.67%       7973   rtview  rtview               [.] std::map<std::pair<int, std::pair<int, int> >, int, std::less<std::pair<int, std::pair<int, int> > >, std::allocator<std::pair<std::pair<int, std::pair<int, int> > const, int> > >::operator[](std::pair<int, std::pair<int, int> > const&)
     0.89%       4240   rtview  libc-2.13.so         [.] __GI_____strtoll_l_internal
適当に思い付くカウンタを並べておくと、
     1235047314800 cycles                    #    0.000 GHz                     [26.68%]
     1223362249600 instructions              #    0.99  insns per cycle         [26.69%]
       31969709556 rd0   # フロントエンドで止まってる                           [26.68%]
      698797279141 rd1   # バックエンドで止まってる。詳細はD[2-A]を見ろ         [26.67%]
       18733713114 rd2   # なんか分岐ミス(あんま理解してない)                   [26.67%]
         140517783 rd3   # serialization?                                       [26.66%]
          69420619 rd4   # segment load ?                                       [26.66%]
      125635596899 rd5   # ROB full                                             [26.67%]
       62311686010 rd6   # RS full                                              [26.68%]
      230373018567 rd7   # FPU full                                             [26.69%]
      302909531759 rd8   # Load Store full                                      [26.69%]
          94065264 rd9   # Dispatch stalls Waiting for All Quiet ?              [26.68%]
          47068578 rda   # Dispatch stalls for Far Transfer or Resync to Retire?[26.68%]
       66729926987 rc2   # リタイアした分岐の数                                 [26.69%]
        1818688796 rc3   # リタイアした分岐ミスの数                             [26.68%]
こんな感じ。D5-D8 は、要因が重なる場合が多い、とBKDG(BIOS and Kernel Developer's Guide)には書いてある。(キャッシュミスとかでロードが止まればロードに依存しているFPUも止まる)
LS full の割合が多い、というのが読み取れる。ということから、キャッシュ回りの問題ではないかと予想される。 例えば、fluidanimate だと、
      180480809226 rd0                                                          [30.78%]
      616766273374 rd1                                                          [30.76%]
      234096951469 rd2                                                          [30.76%]
         183414504 rd3                                                          [30.77%]
          58999681 rd4                                                          [30.75%]
      128862396451 rd5                                                          [30.76%]
       46419690120 rd6                                                          [30.77%]
      183079923702 rd7                                                          [30.78%]
       39479349173 rd8                                                          [30.80%]
         159668291 rd9                                                          [30.80%]
          31058215 rda                                                          [30.80%]
      252246881655 rc2                                                          [30.79%]
       19239248231 rc3                                                          [30.78%]
こんな感じで、D8の割合はそんな高くない。
キャッシュミス率をとろう。
==== i5-2400S ====
(SandyはなんかLLC-loadsで取ると変な値になるみたいなので直接レジスタ値書いてます)
       21259855972 cycles                    #    0.000 GHz
       38440512230 instructions              #    1.81  insns per cycle
       10766805499 r01d1 # L1からロードした数
          13779079 r02d1 # L2からロードした数
           3119601 r04d1 # L3からロードした数
          40338616 r40d1 # メモリからロードした数
                 0 r80d0

       6.525754141 seconds time elapsed

==== A8-3650 ====
       33491556889 cycles                    #    0.000 GHz                     [40.05%]
       38172104049 instructions              #    1.14  insns per cycle         [40.09%]
          93386277 cache-misses              #    0.948 % of all cache refs     [40.14%]
        9853925789 cache-references                                             [40.18%]
       19192784749 L1-dcache-loads                                              [40.11%]
          18579444 L1-dcache-load-misses     #    0.10% of all L1-dcache hits   [40.03%]
          20428633 L1-dcache-stores                                             [39.96%]
     <not counted> L1-dcache-store-misses
         160063373 LLC-loads                                                    [39.88%]
          11008667 LLC-load-misses           #    6.88% of all LL-cache hits    [40.03%]
         153962795 LLC-stores                                                   [40.00%]
     <not counted> LLC-store-misses

      12.940317693 seconds time elapsed
なんかそもそもロードした数が違ってる?ロードを繰り返すだけの単純なループだと、ちゃんと値一致するが。
==== i5-2400S ====
        1255979963 cycles                    #    0.000 GHz
        2158737885 instructions              #    1.72  insns per cycle
        1611457809 r01d1
              4828 r02d1
              2086 r04d1
             10633 r40d1

       0.386291770 seconds time elapsed

==== A8-3650 ====
        1982630608 cycles                    #    0.000 GHz                     [65.98%]
        2160993931 instructions              #    1.09  insns per cycle         [65.98%]
            124951 L1-dcache-misses          #    0.01% of all L1-dcache hits   [65.98%]
        1587882117 L1-dcache-loads                                              [68.08%]
            175305 LLC-loads                                                    [68.25%]
              1960 LLC-misses                #    1.12% of all LL-cache hits    [67.04%]

       0.764530997 seconds time elapsed
あ、i5-2400Sはロード命令の数をとってるが、A8-3650は、L1アクセスの数をとってるのか。なので部分更新すると回数が変わる。
まあいいか。とりあえずそれは忘れて、ミス率がSandyと比べて、そんなに違いがあるわけではない。
annotate でd8を見ると、
    0.00 :	  469d9c:       f3 45 0f 10 0e          movss  (%r14),%xmm9
    0.01 :	  469da1:       f3 41 0f 10 17          movss  (%r15),%xmm2
    0.00 :	  469da6:       f3 45 0f 5c e9          subss  %xmm9,%xmm13
    0.00 :	  469dab:       f3 41 0f 5c d1          subss  %xmm9,%xmm2
    0.01 :	  469db0:       f3 45 0f 10 46 04       movss  0x4(%r14),%xmm8
    0.00 :	  469db6:       f3 45 0f 5c e1          subss  %xmm9,%xmm12
    0.00 :	  469dbb:       f3 41 0f 10 7e 08       movss  0x8(%r14),%xmm7
    0.01 :	  469dc1:       f3 45 0f 5c f9          subss  %xmm9,%xmm15
    0.00 :	  469dc6:       f3 41 0f 10 6f 04       movss  0x4(%r15),%xmm5
    0.00 :	  469dcc:       f3 45 0f 5c f1          subss  %xmm9,%xmm14
    0.02 :	  469dd1:       f3 41 0f 10 77 08       movss  0x8(%r15),%xmm6
    0.00 :	  469dd7:       f3 0f 11 54 24 bc       movss  %xmm2,-0x44(%rsp)
    0.00 :	  469ddd:       f3 41 0f 5c e8          subss  %xmm8,%xmm5
    0.01 :	  469de2:       f3 0f 10 17             movss  (%rdi),%xmm2
    0.00 :	  469de6:       f3 0f 5c f7             subss  %xmm7,%xmm6
    0.00 :	  469dea:       f3 0f 10 5f 04          movss  0x4(%rdi),%xmm3
    0.01 :	  469def:       f3 41 0f 5c d1          subss  %xmm9,%xmm2
    0.00 :	  469df4:       f3 0f 10 67 08          movss  0x8(%rdi),%xmm4
    0.00 :	  469df9:       f3 41 0f 5c d8          subss  %xmm8,%xmm3
 /home/w0/src/parsec-2.1/pkgs/apps/raytrace/obj/amd64-linux.gcc/RTTL/common/RTEmulatedSSE.hxx:784
    0.87 :	  469dfe:       f3 44 0f 11 6c 24 18    movss  %xmm13,0x18(%rsp)
    0.00 :	  469e05:       f3 0f 5c e7             subss  %xmm7,%xmm4
    0.00 :	  469e09:       f3 44 0f 11 64 24 1c    movss  %xmm12,0x1c(%rsp)
    0.00 :	  469e10:       f3 44 0f 11 7c 24 20    movss  %xmm15,0x20(%rsp)
    0.00 :	  469e17:       f3 44 0f 11 74 24 e8    movss  %xmm14,-0x18(%rsp)
    0.00 :	  469e1e:       4c 89 8c 24 a0 03 00    mov    %r9,0x3a0(%rsp)
    0.00 :	  469e25:       00
 /home/w0/src/parsec-2.1/pkgs/apps/raytrace/obj/amd64-linux.gcc/RTTL/common/RTEmulatedSSE.hxx:784
    5.41 :	  469e26:       f3 44 0f 10 9c 24 98    movss  0x398(%rsp),%xmm11
ここで止まってるっぽい。ロードとストアが入り混じってる。 似たようなコードをいくつか書いて試したところ、 K10はロードストアのリオーダが弱いのが問題なのか?というように見える。
	mov	4(%ebp), %edx
	mov	%edx, 12+(16*8)(%ebp)

	mov	4(%ebp), %edx
	mov	%edx, 12+(16*8)(%ebp)

	mov	4(%ebp), %edx
	mov	%edx, 12+(16*8)(%ebp)

        ...
こういうプログラムを書いたとして、これは依存が無い部分があるので、並列に動くはずが、 K10 では動かない。
	mov	4(%ebp), %edx
	mov	%edx, 12+(16*7)(%ebp)

	mov	4(%ebp), %edx
	mov	%edx, 12+(16*7)(%ebp)

	mov	4(%ebp), %edx
	mov	%edx, 12+(16*7)(%ebp)

        ...
これなら動く。多分バンクコンフリクトしている。
Agnerさんのmicroarchitecture.pdfによると、64byteが16byte x 4のバンクになっていて、 そこで衝突する、とのこと。
以下間違い。バンクコンフリクトが正しい
これなら動く。多分、bit4-bit6の一致しか見ていなくて、
- 同じ16byteブロックへのアクセスは衝突する
- 128byte単位で衝突する
感じで、これは、つまり、全く関係の無いポインタ同士でも1/8の確率で衝突するということになる。 一方、Sandyはそういう制限は無い(いわゆるCore2でIntel Advanced Memory Accessと言われて宣伝されてたやつ)
まあ、ただ、時間サンプルで取ったときのホットスポットと、d8のイベントでサンプルしたときの ホットスポットが一致していないので、これが原因かどうかはわからないのだが…
まとめ
多分ポインタのdisambiguationが弱いのだと思うが、はっきりしたことは言えない。
bodytrack
次に差の大きいbodytrack。ボディーをトラックする。(詳細は知らない)
      721802754962 cycles                    #    0.000 GHz                     [26.63%]
      824181722257 instructions              #    1.14  insns per cycle         [26.56%]
       13504637008 rd0                                                          [26.52%]
      369579686903 rd1                                                          [26.57%]
       15135724137 rd2                                                          [26.63%]
         169278947 rd3                                                          [26.70%]
          31443858 rd4                                                          [26.80%]
       62974322214 r0d5                                                         [26.80%]
      198366335471 r0d6                                                         [26.76%]
       88241324058 r0d7                                                         [26.75%]
        9155412614 r0d8                                                         [26.75%]
          94653967 rd9                                                          [26.75%]
          14599467 rda                                                          [26.75%]
       83988200877 rc2                                                          [26.75%]
         951285034 rc3                                                          [26.65%]
大体こんな感じ。d6がでかい。d6はRS Full、というのから、依存が長い、というのが読み取れる。
実際、annotateで見ると、
/*********************************************************************************/
    //pixel access
    int operator()(int x, int y) const
    {   int p = mWidth * y + x;
        int i = p / 8;
        return (mData[i] >> (p % 8)) & 1;
    }


/*********************************************************************************/

//check bounds of nearest integral point and accumulate error value
inline void SampleInsidePointInt(int x, int y, const BinaryImage &FGmap, int &error, int &samplePoints)
{
    if((x >= 0) && (x < FGmap.Width()) && (y >= 0) && (y < FGmap.Height())) //check image bounds
    {   int e = 1 - FGmap(x,y);     /* このoperator()が上の()です */        //get value from image map and compute difference
        error += e;                                                         //sum squared error values (since err = {1,0} same as sum of errors)
        samplePoints++;                                                     //count points sampled
    }
}

/*********************************************************************************/
            // printf("%d\n", n2); n2 = 4 or 5
            for(int j = 0; j < n2; j++)                                         //generate interior samples
            {   SampleInsidePoint(e1.x + delta2 * m.x, e1.y + delta2 * m.y, FGmap, error, samplePoints);
                delta2 += d2;
            }
という部分がネックで、確かに依存がきつそうではある。 試しに依存を切ってみると、それなりに改善する。
            for(int j=0; j<n2; j++) {
                x0[j] = int((e1.x + delta2 * m.x) + 0.5f);
                y0[j] = int((e1.y + delta2 * m.y) + 0.5f);
                delta2 += d2;
            }

            for(int j = 0; j < n2; j++)                                                                                 //generate interior samples
            {   SampleInsidePointInt(x0[j], y0[j], FGmap, error, samplePoints);
            }
==== before ====
     278259.599690 task-clock                #    3.185 CPUs utilized
             82376 context-switches          #    0.000 M/sec
             14587 CPU-migrations            #    0.000 M/sec
             28765 page-faults               #    0.000 M/sec
      721802112812 cycles                    #    2.594 GHz                     [66.80%]
       12447490470 stalled-cycles-frontend   #    1.72% frontend cycles idle    [66.81%]
      371532258900 stalled-cycles-backend    #   51.47% backend  cycles idle    [66.69%]
      824391649749 instructions              #    1.14  insns per cycle
                                             #    0.45  stalled cycles per insn [66.63%]
       84123408685 branches                  #  302.320 M/sec                   [66.52%]
         954068916 branch-misses             #    1.13% of all branches         [66.57%]

      87.375043240 seconds time elapsed

==== after ====
     237491.076529 task-clock                #    3.060 CPUs utilized
             80606 context-switches          #    0.000 M/sec
             14951 CPU-migrations            #    0.000 M/sec
             23391 page-faults               #    0.000 M/sec
      616055397541 cycles                    #    2.594 GHz                     [66.69%]
       13541911929 stalled-cycles-frontend   #    2.20% frontend cycles idle    [66.55%]
      242284408560 stalled-cycles-backend    #   39.33% backend  cycles idle    [66.51%]
      893049251876 instructions              #    1.45  insns per cycle
                                             #    0.27  stalled cycles per insn [66.71%]
       91408306702 branches                  #  384.892 M/sec                   [66.81%]
        1044890646 branch-misses             #    1.14% of all branches         [66.76%]

      77.609998048 seconds time elapsed
じゃあ、むしろなんでNehalem,SandyはRS Fullしないの?という感じだが…推測だと以下
- RS の長さが違う。Nehalemは36、Sandyは54、K10のFPUは14x3。 ループ内では依存があるが、ループ間の依存は無いので、ループ全体を入れられるぐらいRSでかい方が有利
- addssのレイテンシが違う。Nehalem 3, Sandy 3, K10 4
- cvttss2siのレイテンシが違う。 Nehalm 5, Sandy 4, K10 8。
なので、Nehalem、Sandy のほうが速いんではないだろうか
例えば、こういうコードを用意して、NUMINSNを変えたときの、一命令あたりのサイクル数が、
1:
	xorps	%xmm0, %xmm0
	.rept NUMINSN
	addss	%xmm0, %xmm0
	.endr
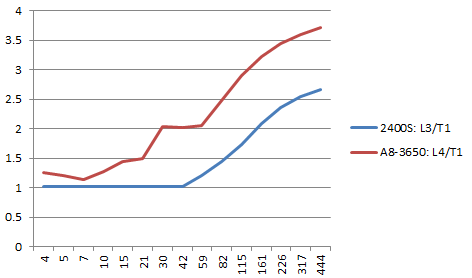
addss
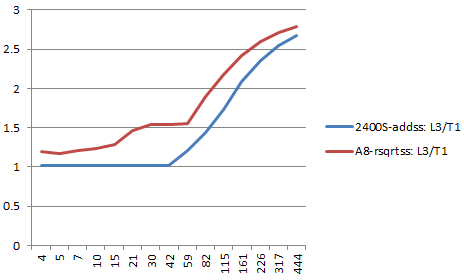
A8-rsqrtss vs i3-addss
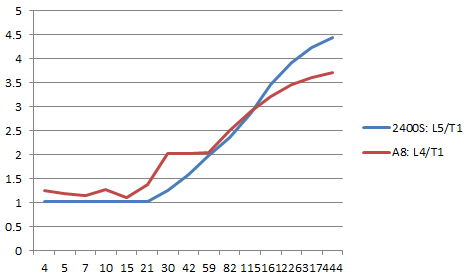
mulss
こんな感じになる、と。 次のことが言えるかと
- A8はaddssのレイテンシが長いので、addssはかなり悪い
- レイテンシが同じA8のrsqrtssとi5のaddssを比べても、A8のほうが悪い
- A8のほうがレイテンシが短いmulssですら相当長い依存を入れないとA8のほうが悪い
公式を含む色んな資料では、K10はFPUはスケジューラ一個だと書いてあってRSの深さは42あるとか書いてあるんだが、 Agnerさんのmicroarchitecture.pdfだけ、FPUのRSは12x3(K8の場合?K10は多分14x3)と書いてあって根拠よくわからんのだが、 見てる感じ、Agnerさんのほうが正しい。 つまり、一個しかユニット使わない場合、RSの深さは14程度しか無いように見える。
まとめ
というわけで、bodytrackに関しては、パイプラインが詰まってしまっていて、 K10でだけパイプラインが詰まるのは、 Sandyと比べてRS浅いのとaddss,cvttss2siのレイテンシが長いからだ、と言えると思う。
x264
じゃあむしろ互角の勝負してるのはなんでよ?ということで、良い勝負をしているx264。
perf report が、以下みたいな感じ。
== i5-2400S ==
# Events: 121K cycles
#
# Overhead  Samples    Command       Shared Object                                    Symbol
# ........ ..........  .......  ..................  ........................................
#
    23.05%      27991     x264  x264                [.] x264_pixel_sad_x4_16x16_sse2
     7.87%       9427     x264  x264                [.] x264_pixel_satd_8x8_internal_ssse3_phadd
     6.74%       8191     x264  x264                [.] x264_pixel_avg2_w16_sse2
     6.12%       7420     x264  x264                [.] x264_me_search_ref
     5.75%       6987     x264  x264                [.] x264_pixel_sad_16x16_sse2
     5.04%       6138     x264  x264                [.] block_residual_write_cabac
     4.93%       5989     x264  x264                [.] x264_cabac_encode_decision_asm
     3.93%       4743     x264  x264                [.] x264_mc_chroma_ssse3
     2.96%       3599     x264  x264                [.] x264_pixel_satd_4x4_ssse3
     1.86%       2250     x264  x264                [.] block_residual_write_cabac
     1.52%       1843     x264  x264                [.] x264_mb_analyse_intra
     1.51%       1824     x264  x264                [.] refine_subpel
     1.28%       1541     x264  x264                [.] x264_macroblock_encode


== A8-3650 ==
# Events: 142K cycles
#
# Overhead  Samples    Command       Shared Object                                 Symbol
# ........ ..........  .......  ..................  .....................................
#
    15.65%      22319     x264  x264                [.] x264_pixel_sad_x4_16x16_sse2_misalign
    11.60%      16320     x264  x264                [.] x264_me_search_ref
     9.27%      13296     x264  x264                [.] x264_pixel_satd_8x8_internal_sse2
     4.65%       6575     x264  x264                [.] block_residual_write_cabac
     3.69%       5288     x264  x264                [.] x264_mc_chroma_sse2
     3.63%       5167     x264  x264                [.] x264_pixel_avg2_w16_sse2
     3.62%       5145     x264  x264                [.] x264_pixel_sad_16x16_sse2
     3.35%       4780     x264  x264                [.] x264_pixel_satd_4x4_mmxext
     3.32%       4771     x264  x264                [.] refine_subpel
     3.17%       4485     x264  x264                [.] block_residual_write_cabac
     2.49%       3569     x264  x264                [.] x264_cabac_encode_decision_asm
     2.35%       3321     x264  x264                [.] get_ref_sse2_misalign
     1.89%       2659     x264  x264                [.] x264_mb_analyse_intra
     1.59%       2279     x264  x264                [.] x264_macroblock_cache_load
Samplesの数を見ると、一番ホットなsad_x4_16x16_sse2_misalignがA8が速くて、それ以外が遅い、という感じに見える。
ちなみに、A8のほうに付いてる 'misalign' は、 AMD の misaligned sse 拡張に対応している、という意味。 misaligned sse は、SSEのload + op演算で16byte alignしてないメモリをオペランドに 取ってもGP発生しないようになる、という拡張。MXCSRの17ビット目を立てると有効になる。 例えば、以下のプログラムが動く。
        .bss
        .align  16
        .comm   data, 32
        .comm   mask, 4

        .text
        .globl  main
main:
        stmxcsr mask
        orl     $0x20000, mask
        ldmxcsr mask

        paddd   data+8, %xmm0

        ret
で、sad_x4_16x16だが、annotateの結果が以下のとおり。
==== 2400S ====
         :	00000000004c4810 :
 ??:0
    0.59 :	  4c4810:       66 0f 6f 3f             movdqa (%rdi),%xmm7
    0.10 :	  4c4814:       f3 0f 6f 06             movdqu (%rsi),%xmm0
    4.12 :	  4c4818:       f3 0f 6f 0a             movdqu (%rdx),%xmm1
    3.34 :	  4c481c:       f3 0f 6f 11             movdqu (%rcx),%xmm2
    3.88 :	  4c4820:       f3 41 0f 6f 18          movdqu (%r8),%xmm3
    1.95 :	  4c4825:       66 0f f6 c7             psadbw %xmm7,%xmm0
    0.63 :	  4c4829:       66 0f f6 cf             psadbw %xmm7,%xmm1
    0.59 :	  4c482d:       66 0f f6 d7             psadbw %xmm7,%xmm2
    0.49 :	  4c4831:       66 0f f6 df             psadbw %xmm7,%xmm3
    0.45 :	  4c4835:       66 0f 6f 7f 10          movdqa 0x10(%rdi),%xmm7
    0.12 :	  4c483a:       f3 42 0f 6f 24 0e       movdqu (%rsi,%r9,1),%xmm4
    0.98 :	  4c4840:       f3 42 0f 6f 2c 0a       movdqu (%rdx,%r9,1),%xmm5
    1.74 :	  4c4846:       f3 42 0f 6f 34 09       movdqu (%rcx,%r9,1),%xmm6
    2.10 :	  4c484c:       f3 47 0f 6f 04 08       movdqu (%r8,%r9,1),%xmm8
    1.49 :	  4c4852:       66 0f f6 e7             psadbw %xmm7,%xmm4


==== A8 ====
         :	00000000004c7da0 <x264_pixel_sad_x4_16x16_sse2_misalign>:
 ??:0
    1.41 :	  4c7da0:       66 0f 6f 1f             movdqa (%rdi),%xmm3
    1.96 :	  4c7da4:       f3 0f 6f 06             movdqu (%rsi),%xmm0
    0.00 :	  4c7da8:       f3 0f 6f 0a             movdqu (%rdx),%xmm1
    0.00 :	  4c7dac:       f3 0f 6f 11             movdqu (%rcx),%xmm2
    0.70 :	  4c7db0:       66 0f f6 c3             psadbw %xmm3,%xmm0
    0.00 :	  4c7db4:       66 0f f6 cb             psadbw %xmm3,%xmm1
    0.00 :	  4c7db8:       66 0f f6 d3             psadbw %xmm3,%xmm2
    0.60 :	  4c7dbc:       66 41 0f f6 18          psadbw (%r8),%xmm3
    0.13 :	  4c7dc1:       66 0f 6f 7f 10          movdqa 0x10(%rdi),%xmm7
    0.02 :	  4c7dc6:       f3 42 0f 6f 24 0e       movdqu (%rsi,%r9,1),%xmm4
    0.69 :	  4c7dcc:       f3 42 0f 6f 2c 0a       movdqu (%rdx,%r9,1),%xmm5
    0.00 :	  4c7dd2:       f3 42 0f 6f 34 09       movdqu (%rcx,%r9,1),%xmm6
    0.00 :	  4c7dd8:       66 0f f6 e7             psadbw %xmm7,%xmm4
    0.56 :	  4c7ddc:       66 0f f6 ef             psadbw %xmm7,%xmm5
    0.00 :	  4c7de0:       66 0f f6 f7             psadbw %xmm7,%xmm6
Sandyちゃんのほうはmovdquで止まってる…ように見える。 手元で色々試したところ、なんか、Sandyちゃんはキャッシュライン跨いだ時に movdquのスループットが1/4.5になるっぽい。
#include <x86intrin.h>
#include <stdio.h>
char data[64] __attribute__((aligned(128)));
#define S_(v) #v
#define S(v) S_(v)

int main()
{
    int i;
    int b, e, shift;
    int nloop = 1024;
#define NUM_INSN 32

    for (shift=-16; shift<16; shift+=4) {
        b = __rdtsc();
        for (i=0; i<nloop; i++) {
            __asm__ __volatile__(".rept " S(NUM_INSN) " \n\t"
                                 "movdqu (%0), %%xmm0\n\t"
                                 ".endr\n\t"
                                 :
                                 :"r"(data+shift));
        }
        e = __rdtsc();
        printf("movdqu %4d:%f\n", shift, (e-b)/(double)(nloop*NUM_INSN));
    }

    for (shift=-16; shift<16; shift+=4) {
        b = __rdtsc();
        for (i=0; i<nloop; i++) {
            __asm__ __volatile__(".rept " S(NUM_INSN) " \n\t"
                                 "lddqu (%0), %%xmm0\n\t"
                                 ".endr\n\t"
                                 :
                                 :"r"(data+shift));
        }
        e = __rdtsc();
        printf("lddqu  %4d:%f\n", shift, (e-b)/(double)(nloop*NUM_INSN));
    }
}
とかやると、結果が
2400S:
movdqu  -16:0.501587
movdqu  -12:4.503540
movdqu   -8:4.504150
movdqu   -4:4.502808
movdqu    0:0.500854
movdqu    4:0.500854
movdqu    8:0.500977
movdqu   12:0.500854
lddqu   -16:0.501465
lddqu   -12:4.505493
lddqu    -8:4.506958
lddqu    -4:4.502808
lddqu     0:0.500854
lddqu     4:0.500977
lddqu     8:0.500977
lddqu    12:0.500977

a8:
movdqu  -16:0.504059
movdqu  -12:1.003326
movdqu   -8:1.002869
movdqu   -4:1.002869
movdqu    0:0.502869
movdqu    4:1.002869
movdqu    8:1.002869
movdqu   12:1.002899
lddqu   -16:0.504028
lddqu   -12:1.002899
lddqu    -8:1.002869
lddqu    -4:1.002869
lddqu     0:0.502838
lddqu     4:1.002899
lddqu     8:1.002899
lddqu    12:1.002869
こんな感じ。
x264の詳細は知らないけど、バイト単位で探索してるのだとすると、
- 2400Sの平均スループットは、(0.5 * (15/64)) + (4.5 * (49/64)) = 1.4375
- A8の平均スループットは、(0.5 * 1/4) + (1.0 * 3/4) = 0.875
で、A8の方が速い。
以下間違い。キャッシュライン境界跨いだ時の問題。 スタックのASLRと見間違えてたっぽい。
Sandyちゃんのほうはmovdquで止まってる…ように見える。 手元で色々試したところ、なんか、Sandyちゃんのmovdquは弱点があるっぽい。
=== 1. 16byte align ===
	movdqu	0(%ebp), %xmm0

=== 2. 16align+12 ===
	movdqu	12(%ebp), %xmm0

=== 3. 16 byte align でふたつのレジスタから movdqu ===
	movdqu	0(%ebp), %xmm0
	movdqu	0(%ebx), %xmm1

=== 4. Sandyの秘孔 (アラインされないふたつのレジスタからmovdqu) ===
	movdqu	4(%ebp), %xmm0
	movdqu	4(%ebx), %xmm1
とかやると、4のケースだけSandyはスループットが1/5になってしまう。
| - | 1. 16byte align | 2.16 align+12 | 3. regx2 | 4. Sandyの秘孔 | ||||
| - | スループット | レイテンシ | スループット | レイテンシ | スループット | レイテンシ | スループット | レイテンシ |
| A8 | 0.5 | 1 | 1 | 4 | 0.5 | 1 | 1 | 4 |
| i5 | 0.5 | 1 | 0.5 | 1 (6?) | 0.5 | 1 | 2.5? | 1 (6?) |
(6? は、なんか、命令数が16個?の場合遅くなるっぽい。謎。)
まとめ
というわけで、x264については、一番ヘヴィなループが、Sandyの秘孔を突くようになっているので、 そこだけA8が速くて、他の遅いのをカバーしてる、というように見える。
freqmine
FPばっかりなのでINTもやるか… → 多分分岐ミス
==== i5 ===
 Performance counter stats for '/home/w0/src/parsec-2.1/pkgs/apps/freqmine/inst/amd64-linux.gcc/bin/freqmine kosarak_990k.dat 790':

       7659.414934 task-clock                #    0.999 CPUs utilized
                54 context-switches          #    0.000 M/sec
                14 CPU-migrations            #    0.000 M/sec
             44478 page-faults               #    0.006 M/sec
       19124298798 cycles                    #    2.497 GHz
        5984428646 stalled-cycles-frontend   #   31.29% frontend cycles idle
        3566965121 stalled-cycles-backend    #   18.65% backend  cycles idle
       33028727426 instructions              #    1.73  insns per cycle
                                             #    0.18  stalled cycles per insn
        5284524739 branches                  #  689.938 M/sec
         165269947 branch-misses             #    3.13% of all branches

       7.669965372 seconds time elapsed


==== A8 ====
 Performance counter stats for '/home/w0/src/parsec-2.1/pkgs/apps/freqmine/inst/amd64-linux.gcc/bin/freqmine kosarak_990k.dat 790':

       9618.314158 task-clock                #    1.000 CPUs utilized
                10 context-switches          #    0.000 M/sec
                 0 CPU-migrations            #    0.000 M/sec
             44479 page-faults               #    0.005 M/sec
       24919776339 cycles                    #    2.591 GHz                     [66.69%]
        3295369877 stalled-cycles-frontend   #   13.22% frontend cycles idle    [66.72%]
        6808976377 stalled-cycles-backend    #   27.32% backend  cycles idle    [66.73%]
       33044486050 instructions              #    1.33  insns per cycle
                                             #    0.21  stalled cycles per insn [66.73%]
        5286242131 branches                  #  549.602 M/sec                   [66.67%]
         297705884 branch-misses             #    5.63% of all branches         [66.57%]

       9.618772554 seconds time elapsed
for (int j = 0; Trans[j] != mark; j ++) {
    int item = local_global_order_array[Trans[j]];
    if (item < num_hot_item) {
        if (item != -1)
            ntype |= (1 << item);
    } else {
        local_origin[item]=1;
        has++;
        if (item > max_itemno)
                max_itemno = item;
    }
}
まとめ
分岐
こんくるーじょん
何故SandyがK10より速いかというと、
- 分岐予測の改善
- 命令レイテンシの低減
- RSの拡大(というか単一RS)
- メモリアクセスのOut-of-Order
といった点が理由で、まあ、地道に改善してある、という感じだった。
あと、基本的にIntelのほうは弱点改善されていくという印象があるので、movdquも多分そのうち改善されるでしょう。
あと、parsecは浮動小数に偏りすぎな気がしたので整数もやったほうがよかったかも。
おまけ1 : Bulldozerで速くなるか
最適化されてないスカラのプログラムを考えた時、K10が特に弱いのは、 命令ユニットあたりのRSの大きさで、 K10は依存がきついプログラムだと、整数が10、浮動小数が14で、Sandyの54と比べると大分小さいので、 そこが改善されていればなんとかなるのかも。 Int Schedulerのエントリ数書いてないのでなんとも言えないが… FP Schedulerは64-entryとか書いてあって、統合かどうかはわからんが、 4ユニットで分けたとしたら、16…16かぁ… 統合スケジューラなら速くなる、分割されてたらそんな変わらん、と予想。
おまけ2
参考文献
- Intel(R) 64 and IA-32 Architectures Optimization Reference Manual
- Intel 公式
- Software Optimization Guide for AMD Family 10h and 12h Processors
- AMD 公式
- Software optimization resources
- 僕がよく「Agnerさんの資料」と言ってるやつ。
- PARSEC
- PARSECベンチマーク
- Intel(R) 64 and IA-32 Architectures Software Developer's Manual Combined Volumes 3A and 3B: System Programming Guide, Parts 1 and 2
- Intelのパフォーマンスカウンタの詳細はVolume 3です
- BIOS and Kernel Developer’s Guide (BKDG) For AMD Family 12h Processors
- AMDのパフォーマンスカウンタの詳細はBKDGにのってます
- Intel Core 2 全方位ベンチマーク - 新アーキテクチャの真実を見極める ・ Core MicroArchitectureをもうすこし
- Core2の隅つつき。PCパーツのレビューの中で一番よくできてると思う。 他のレビュアーはこれを見習うべき。
- 高性能コンピュータ技術の基礎
- Out-of-Orderについて詳しく書いてある。RS、ROBて何?という方は。
この文書について
この文書はx86/x64最適化勉強会1のために書かれました。